This isn’t as simple a question to answer as you might think. In fact, the actual figure, when you take illegal hunting into account, is impossible to determine. But we can get an accurate picture of the effect of pandemic years by using both US FWS licence sales apportionment data (2 years old) and current ASA data.
Key takeaways:
- In 2019 the US FWS reported 15.2 Million hunting licence holders in the US
- In 2020 (the depths of the pandemic), hunting licence holders are expected to grow by about 9.2% from the previous year from 15.2 Million (2019) to 16.6 Million.
- In 2021 (as the pandemic restrictions begin to ease), hunting licence holders are expected to decrease by 4.5% from 16.6 Million (2020 est) to 15.8 Million. This is still 5% above their pre pandemic low in 2019 of 15.2 Million.
Want to know which state has the most hunters, or what age group hunts the most? Take a look at our in-depth hunting statistics round-up.
Apportionment Data – Understand it before quoting it
Many websites will grab you with the headline 15.2 million licence holders in 2021 figure that comes from the U.S. Fish and Wildlife Service (FWS) data on Apportionments (that’s financial info from where funds from licence sales are distributed).
The problem is, if you actually read the fine print about the FWS data, you’ll find that it isn’t up to date. The apportionment year is two years after the states actually issued the hunting licences. The costs and number of licence holders they report for 2021 represents hunting licence sales that actually ocurred in 2019.
There are other problems with using those figures too:
- They don’t include people who purchase lifetime hunting licences or multi year licences (so don’t pay each year)
- They exclude people who aren’t required to purchase a licence, such as landowners, certain age ranges
- They also double count people who purchase licences in multiple states
- They makes no attempt to differentiate between different types of activity fishing, bowhunting, firearms hunting
- The exclude illegal hunting (but okay, nobody is easily going to be able to track that anyway)
They also top the dashboard with this often misunderstood headline (actually it should be 2019 and 2018):
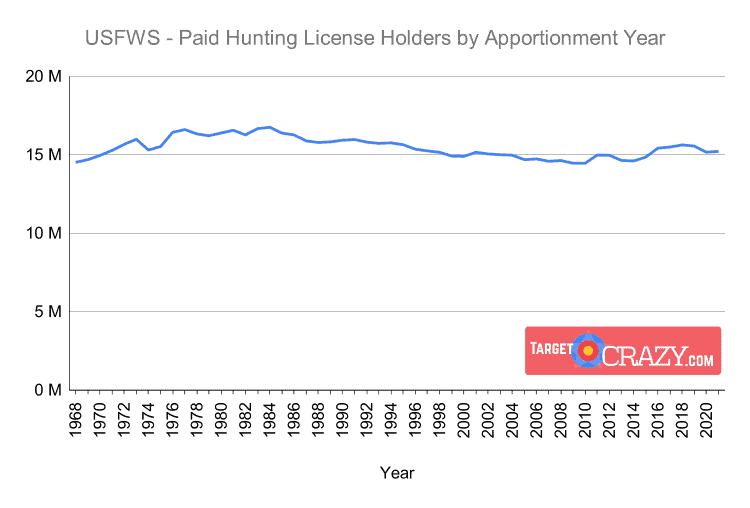
Total Paid Hunting License Holders for 2021 increased by 0.29% (44,226) from 15,158,443 in 2020 to 15,202,669.
US FWS Apportionment Data Dashboard
If you look at the apportionments data dashboard from the US FWS, this is what you’ll see.
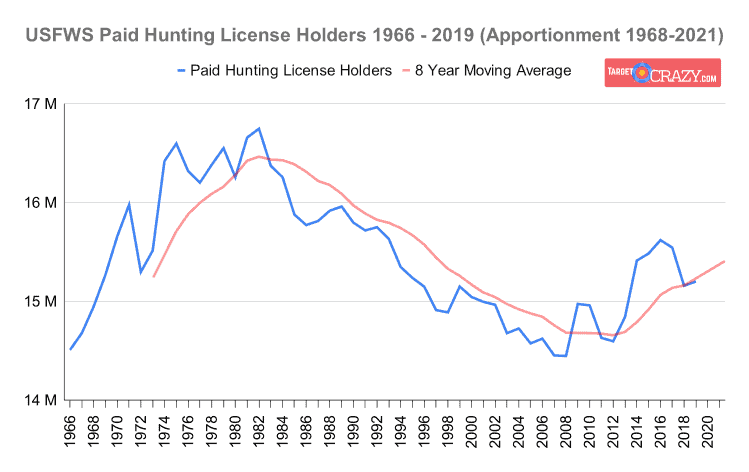
We downloaded that data, re-plotted it, zoomed in a little, adjusted for the CORRECT YEAR (2 years previous) and added a trendline. Here’s how that looks.
Now that’s a little more interesting! See a trend?
But we can still only see upto 2019, which is PRE PANDEMIC.
How do we get a more up-to-date picture?
Adding Sportsman Participation Data
A new data initiative perpared by Southwick Associates and funded by the US FWS for the American Sportfishing Association takes a more up-to-date look at licence sales.
This data is intended to be more accurate and give a more detailed view of hunting trends within participating states. This data is more accurate because it accounts for the following things:
- It accounts for anglers or hunters who carried over a licence
- It accounts for multi year licences, combo licences and lifetime licences
- It accounts for NEW participants purchasing a licence and those who failed to renew CHURN
- It gives an accurate figure for participation in hunting by state residents and non-state residents
The problem? Only 20 states submitted data, and it only goes back 10 years to 2010.
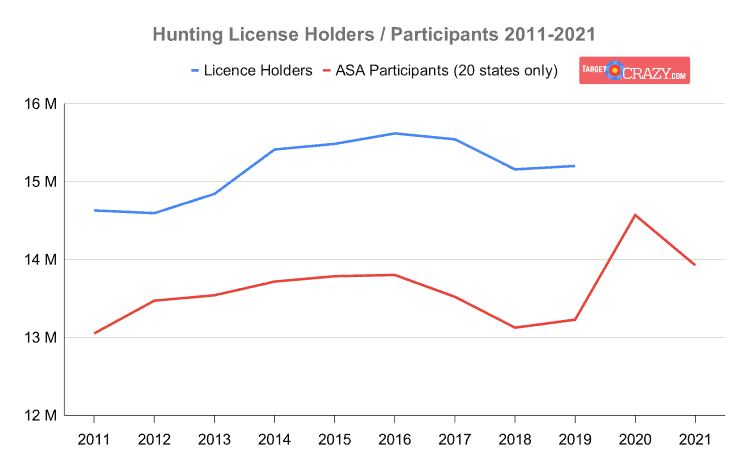
So what can we use it for? Well, it’s intention is to highlight trends. So if you plot the ASA data alongside the US FWS data, you’ll see that the trend since 2014 is very similar in both, but the ASA data has info for 2020 and 2021 (the depths of the pandemic).
Here it is:
You can see that from 2012 to 2019 both data sets follow a similar trend and you could reasonably expect that to continue into 2020 and 2021 when the latest apportionment data is released from the US FWS.
What can we take from this?
In 2020 (the depths of the pandemic), participants in hunting and fishing are expected to grow by about 9.2% from the previous year.
In 2021 (as the pandemic restrictions began to ease), participants are expected to decrease by 4.5% from 2021, but still be well above (5%) their low in 2019.
If you take these estimations and apply them to the hunter numbers most sites use from US FWS apportionment data, you can estimate the new headline USFWS figures to be:
Total Paid Hunting Licence Holders for 2020 (apportioned in 2022) to increase by 9.2% (1.4 Million) from 15.2 Million to 16.6 Million.
Total Paid Hunting Licence Holders for 2021 (apportioned in 2023) to decrease by 4.6% (0.6 Million) from 16.6 Million to 15.8 Million.
Estimated figures for upcoming hunter licence sales based on US FWS data and ASA participation data


