Recreational hunting is one of Americas greatest traditions. Hunter numbers were trending upwards since 2012 (pre-pandemic) and there are expected to be about 15.8 Million hunters recorded as paying for licences in 2021.
After spending countless hours looking through different sources, we’ve completed a deep dive into all the information available on hunting in the US and found some results that might suprise you!
Here’s what you’ll learn about hunting in the US:
Table of Contents
Hunting Statistics – Top Picks
- The effects of the pandemic are expected to boost hunting licence sales since 2019 by 9.2% in 2020 and 5% in 2021.
- There are expected to be 15.8 Million hunting licence holders in the US in 2021 (up 0.6 Million since 2019).
- Numbers of hunting licence holders were in a downtrend from 1982 to 2012, but have been trending upwards since 2012, and received an extra boost from the pandemic years
- 4.7% of the population paid for a hunting licence in 2021
- Since 2011 female hunters have increased by 28%
- From 2011 to 2021 the numbers of 55-64 year old hunters has increased the most by 12%
- There are 35% less 18-24 year old hunters than all other age groups from 25-64
- Texas had the highest hunter numbers in 2021
- North Dakota had the highest participation rate in 2021 with a ratio of 2.6 hunters to every 10 residents
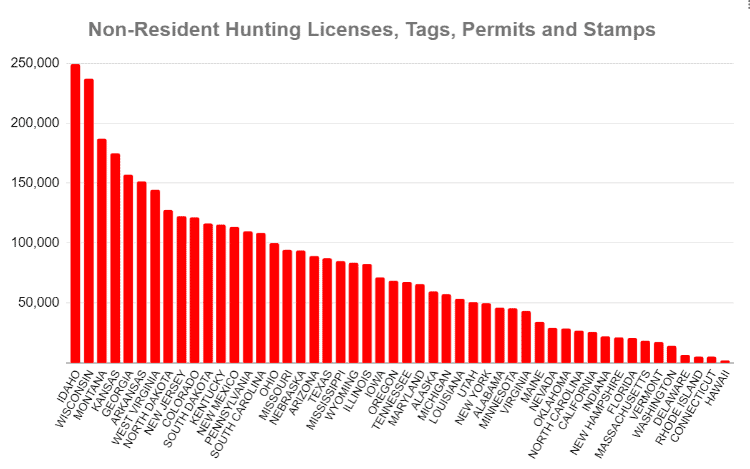
- Idaho is the most visited state for hunting with nearly 250,000 non resident permits issued
- Montana issues the most residents with hunting permits, 79% of it’s population are permitted to hunt
- In 2020, 26% of deer were harvested using a bow/crossbow, 6% a muzzleloader and 65% a rifle/shotgun
- New Jersey has the most successful bow hunters
- Hunting contributed approximately $109 Billion to the US economy in 2020 and supported 688,500 jobs
- Deer hunting is by far the most popular type of hunting with over 47% of the market share
- Hunters spend around $2000 per head each year on hunting
- Hunting accidents were responsible for only 1 fatality in 2021
How many hunters are there in the US in 2026?
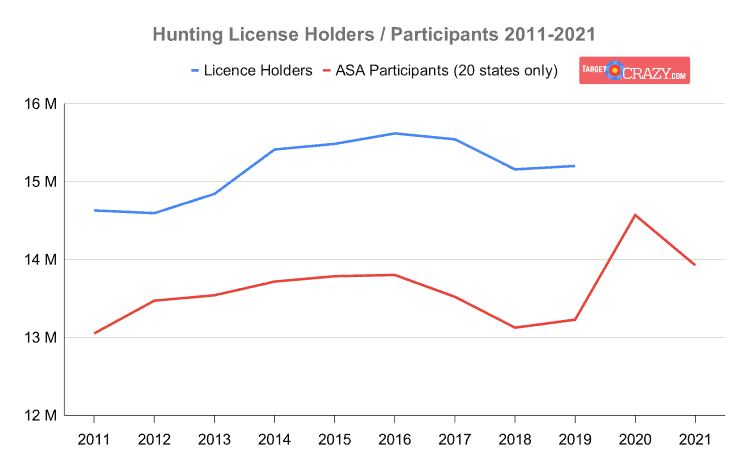
- In 2019 the US FWS reported 15.2 Million hunting licence holders
- In 2020 (the depths of the pandemic), hunting licence holders are expected to grow by about 9.2% from the previous year 16.6 Million
- In 2021 (as the pandemic restrictions begin to ease), hunting licence holders are expected to decrease by 4.5% to 15.8 Million
The US Fish and Wildlife Service provides financial data about revenue from hunting licences 2 years AFTER they were sold. Most quoted figures you see online are out of date. In order to estimate current numbers we needed to overlay the most recent trends from 20 states that reported data on top of those sales figures. If you want more info check out our results.
Source: US FWS / ASA
Is hunting gaining or losing popularity?
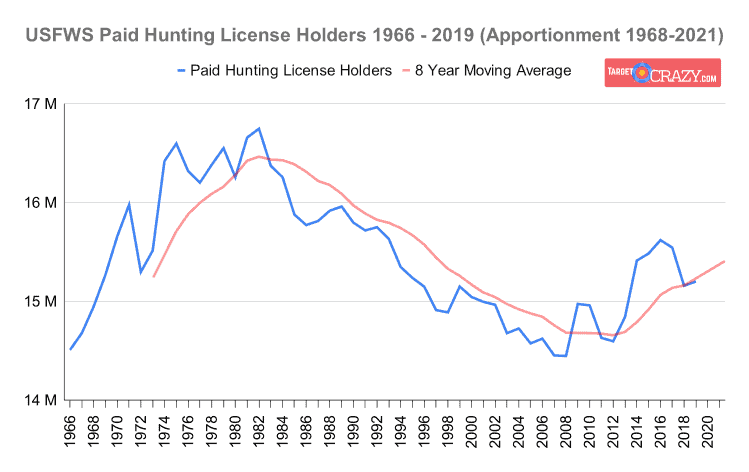
Numbers of hunting licence holders were in a downtrend from 1982 to 2012, but have been trending upwards since 2012, and are set to receive an extra boost from the pandemic years
As you can see from our analysis of the US FWS hunting licence apportionment data that covers the years 1966 to 2019, hunter numbers were trending downwards from the 1980’s until around 2012 when they started an uptrend. This FWS data uptrend is going to be further boosted by the pandemic years (see our analysis).
Source: US FWS / ASA
What percentage of US citizens hunt?
4.7% of the US population pay for a hunting licence
In 2021 there were an estimated 15.8 Million paying hunting licence holders. The US population is estimated at 332 Million in 2021. Therefore, 4.7% of the population paid for a hunting licence.
This statistic does not account for lifetime licence holders, multi-year licence holders, people in certain states and age brackets who do not require a licence and illegal hunters. But you can safely assume these numbers would only have a marginal effect on the total percentage anyway.
Sources: US Census Bureau, US FWS / ASA
What percentage of hunters are female?
In 2021 12.3% of hunting participants were female, an increase of 28% since 2011
The ASA hunter licence data dashboard reports on data upto 2021 and is designed to show trends in hunter participation rather than correct counts as only 20 states participate fully in the program. Here’s the breakdown.
| Gender | Change since 2011 |
|---|---|
| Male | -4% |
| Female | 28% |
Source: ASA
What age ranges hunt the most?
From 2011 to 2021 the numbers of 55-64 year old hunters has increased the most by 12%. The age range of 18-24 has approximately 35% less hunters than all other age ranges.
Here’s the breakdown of the percentages and change in hunter age ranges from 2011 to 2021:
| Age Range | % Of Participants | Change since 2011 |
|---|---|---|
| 18-24 | 12.9% | -1% |
| 25-34 | 21.4% | 4% |
| 35-44 | 22.5% | 2% |
| 45-54 | 21.2% | -17% |
| 55-64 | 21.8% | 12% |
Source: ASA
Which US state has the most hunters?
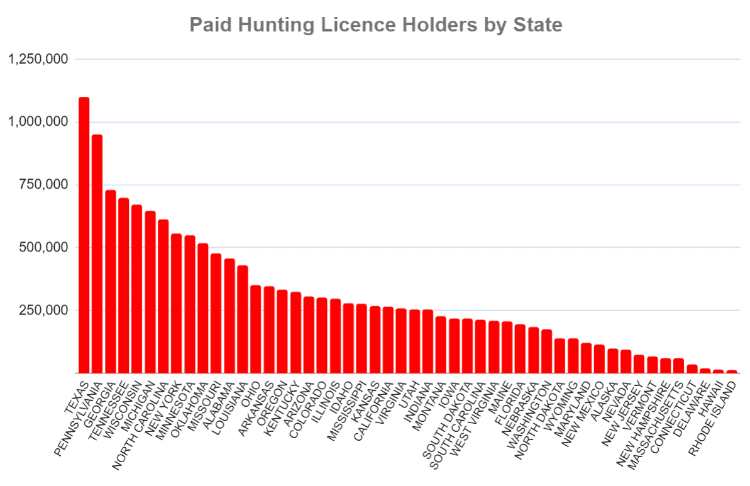
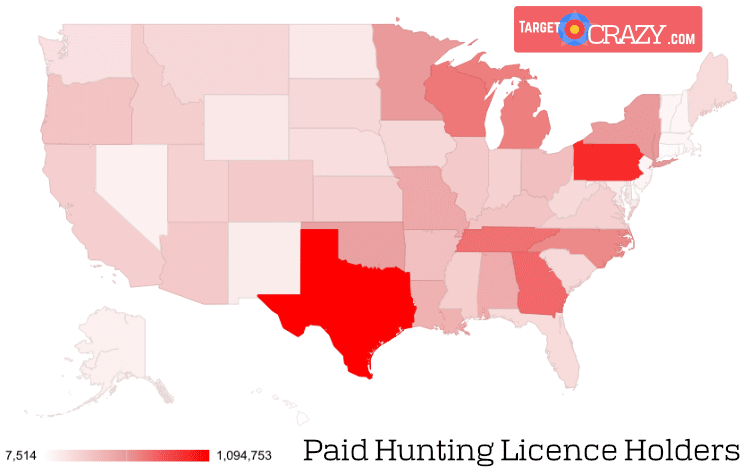
Texas had the most hunters with 1,989,094 participants hunting in 2021’s figures
Texas topped the US FWS licence fee charts for 2019 and ASA trends show it still going strong in 2021 with 16% (1.78M) of it’s residents participating in hunting and 200,000 non-residents visiting to hunting there.
Here’s a breakdown of the most and least popular hunting states in the US from 2019 US FWS paid licence sales.
Source: Hunter Demographics (US FWS)
Which US state has the highest hunting participation rate?
The ratio of paying hunting licence holders to the population of North Dakota was 18% in 2021. That’s just under 2 hunters for every 10 residents.
North Dakota had an 18% hunting participation rate in 2021. That’s the highest of the 20 reporting states from the latest ASA data. Of the 123,042 hunters only 84,015 were residents.
Source: ASA, US Census Bureau
Which US state issues the most residents with hunting licences?
A whopping 79% of the residents of Montana were issued with a hunting licence in 2019
Here’s a breakdown of the top 10 states with high resident hunting licences numbers from the 2019 US FWS data (apportionment / release year 2021).
| State | Resident Hunting Licences, Permits and Tags | Population | Ratio |
|---|---|---|---|
| MONTANA | 853,341 | 1,068,778 | 79.84% |
| IDAHO | 1,412,039 | 1,787,065 | 79.01% |
| WISCONSIN | 3,965,367 | 5,822,434 | 68.10% |
| ALASKA | 423,501 | 731,545 | 57.89% |
| NORTH DAKOTA | 375,250 | 762,062 | 49.24% |
| WYOMING | 186,849 | 578,759 | 32.28% |
| SOUTH DAKOTA | 241,059 | 884,659 | 27.25% |
| WEST VIRGINIA | 484,447 | 1,792,147 | 27.03% |
| OREGON | 1,250,170 | 4,217,737 | 29.64% |
| MISSOURI | 1,718,224 | 6,137,428 | 28.00% |
Source: US FWS, US Census Bureau, Hunter Demographics
What’s the most popular state to visit for hunting?
In 2019 Idaho issued 248,610 non resident hunting tags, permits and stamps.
Here’s a breakdown of the number of non-resident hunting licences sold in 2019 from the US FWS hunting licence apportionment data.
Source: US FWS, US Census Bureau, Hunter Demographics
What percentage of successful hunts are bow hunts?
In 2020 26% of all whitetail deer were harvested using a bow or crossbow, 65% using a rifle/shotgun and only 9% using a muzzleloader
The National Deer Association report for 2022 covers most US states and 4 Canadian provinces and reports on the details of recorded hunts. It recorded that 26% of whitetail deer were harvested using a bow or crossbow. This correlates with the 2016 national survey of fishing, hunting and associated wildlife recreation that found that 32% of hunters aged 16 or over used a bow, 12% used a mizzleloader, but a whopping 87% used firearms (shotgun, rifle, etc).
Source: US Census Survey, NDA Deer Report
Which state has the most successful bowhunters?
In 2020 64% of deer harvested in New Jersey were taken by a bow or crossbow
Here’s the breakdown of the top states and their percentages of deer harvest by weapon type:
| Weapon | State | Percent of Harvest |
|---|---|---|
| Bow/Crossbow | New Jersey | 64% |
| Bow/Crossbow | Connecticut | 58% |
| Bow/Crossbow | Massachussets | 50% |
| Bow/Crossbow | Ohio | 48% |
| Bow/Crossbow | Illinois | 46% |
| Rifle/Shotgun | Wyoming | 94% |
| Rifle/Shotgun | Montana | 92% |
| Rifle/Shotgun | California | 91% |
| Rifle/Shotgun | Idaho | 91% |
| Rifle/Shotgun | South Carolina | 89% |
| Muzzleloader | Rhode Island | 42% |
| Muzzleloader | New Hampshire | 25% |
| Muzzleloader | Vermont | 24% |
| Muzzleloader | Virginia | 23% |
| Muzzleloader | Massachusetts | 21% |
Source: NDA Deer Report
What does hunting do for the US economy?
All hunting activities in the US add approximately $109 Billion to the US economy and support over 688,500 jobs.
The latest Economic impact analysis of hunting activities report compiled in 2020 by Southwick Associates gives the following figures for the economic impact of hunting activities in the US:
| Hunting Type | Retail Sales | Total Effect | Jobs |
|---|---|---|---|
| Deer Hunting | $23.3 Bn | $50.7 Bn | 325,300 |
| Migratory Bird | $4.4 Bn | $10.1 Bn | 70,300 |
| Upland Game | $3.7 Bn | $8.1 Bn | 54,900 |
| Other | $18 Bn | $41 Bn | 238,000 |
| Total | $49.4 Bn | $109.9 Bn | 688,500 |
Source: US FWS
What is the most popular type of hunting?
Deer hunting is the most popular type of hunting with over 47% of the market share in 2020
Here’s the breakdown of the economic impact of hunting data from the USFWS data with a calculated market share for each type:
| Hunting Type | Retail Sales | Market Share |
|---|---|---|
| Deer Hunting | $23.3 Bn | 47.17% |
| Migratory Bird | $4.4 Bn | 8.91% |
| Upland Game | $3.7 Bn | 7.49% |
| Other | $18 Bn | 36.4% |
Source: US FWS
How much do hunters spend on average / year?
On average a hunter will spend $2,000 per year on retail goods related to hunting
Analysis of the Economic Imact of Hunting and Shooting report in 2020 gives a total retail sales figure of $49.4 Billion dollars of retail sales on hunting activities, if hunter numbers in 2020 are estimated at 15 million, that’s approximately $2,000 spent per hunter.
Source: Southwick Associates
How safe is hunting?
In the combined years of 2019, 2020 and 2021 there were zero reported bowhunting incidents of any type whilst shotguns, rifles, crossbows and other weapons were responsible for 43 incidents and 5 fatalities.
Here’s the breakdown of incidents reported by weapon type:
| Weapon | 2019 | 2020 | 2021 |
|---|---|---|---|
| Shotgun | 8 | 10 | 5 |
| Rifle | 3 | 5 | 4 |
| Handgun | 1 | 0 | 0 |
| Muzzleloader | 0 | 4 | 0 |
| Crossbow | 0 | 2 | 0 |
| Bow | 0 | 0 | 0 |
| Air Gun | 0 | 1 | 0 |
| Total Incidents | 12 | 22 | 9 |
And the breakdown of the severity of those incidents:
| Incident Type | 2019 | 2020 | 2021 |
|---|---|---|---|
| Fatal | 1 | 3 | 1 |
| Non-fatal | 11 | 19 | 8 |
| Self-inflicted | 5 | 13 | 2 |
| Two-party | 7 | 9 | 7 |
